
Table of Contents
Introduction #
This plugin provides users with the most important part of an exam/quiz, i.e, analytics. Every attempt each user makes on a quiz is scrutinized and relevant data are portrayed via visually appealing graphs.
Admin Configuration #
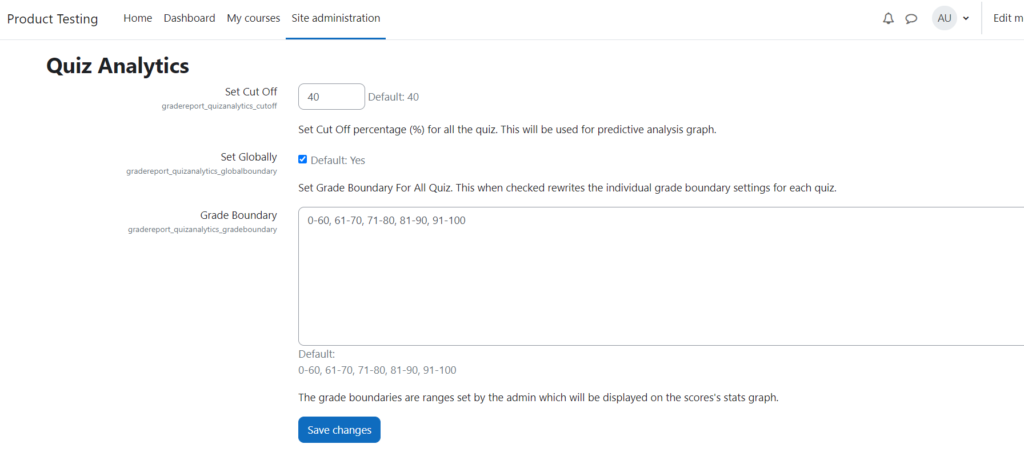
There is a settings panel to help the admin configure the plugin to best fit their requirement. For this goto Site Admininstrator >> >> Grades >> Report settings >> Quiz Analytics.
There you will have the following options :
- Set Cut Off : Set Cut Off percentage (%) for all the quizzes. This will be used for the predictive analysis graph. If you have set 40%, then the graph will show which questions attempted are above the defined rate.
- Set Globally: Set Grade Boundary For All Quiz. If enabled, then along with admin, students can see their grades.
- Grade Boundary: The grade boundaries are ranges set by the admin which will be displayed on the scores’ stats graph. Like if you have set boundaries like 0-60, 61-70, 71-80, 81-90, 91-100
- This will be Grade A for students who scored between 0-60, Grade C for students who scored between 71-80 etc.
Brief Workflow #
This plugin provides users with the most important part of an exam/quiz, i.e, analytics. Every attempt each user makes on a quiz is scrutinized and relevant data are portrayed via visually appealing graphs.
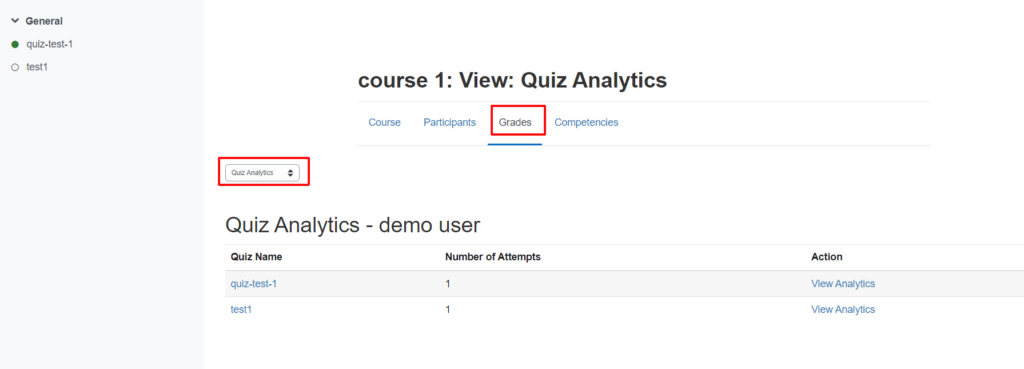
The graphs are distributed under the following tabs:
- Attempt Summary- This tab contains the logged-in user’s statistics for the last attempt he/she made on that quiz. In the case of quizzes allowing a single attempt, that attempt is considered the last attempt.
- My Progress and Predictions- This tab contains several sub-tabs which as a whole give the idea of how the logged-in user has fared over time and the hardest question he/she faced. There’s also a tab specifically for quizzes offering multiple attempts to show the logged user a predictive analysis depending on other users’ attempts and best scores.
- Question Categories’ Analysis- This tab is dedicated to the categories/tags all the questions are associated with. The graphs here in the sub-tabs show the question distribution among categories and also an idea of how challenging each of the categories proved to be.
- Scores’ and Questions’ Stats- This tab contains two sub-tabs, one showing the number of students in each grade category and the other providing a thorough analysis of all the questions present in the quiz.